L
O
A
D
I
N
G


Zoho, Odoo, ERPNext, Dynamics 365 and custom ERP, delivered by one accountable team.

We bring ERP data together with CRM, e-commerce, HR and spreadsheet sources in a governed data model, then build analysis in Power BI or Zoho Analytics.
ERP business intelligence in the UAE means building a layer above the ERP: pipelines extract data from ERP, CRM, e-commerce and HR sources into a warehouse or analytics store, a shared semantic model sets definitions, and reports are built in Microsoft Power BI or Zoho Analytics. It suits multi-entity groups and companies running more than one core system.
ERP Business Intelligence UAE projects answer questions a single ERP cannot answer on its own. How does marketing spend in one channel affect margin three months later? Which customers buy from both the online store and the showroom? How does profitability compare across group companies running different systems, perhaps Odoo in a trading arm and Business Central in a contracting arm?
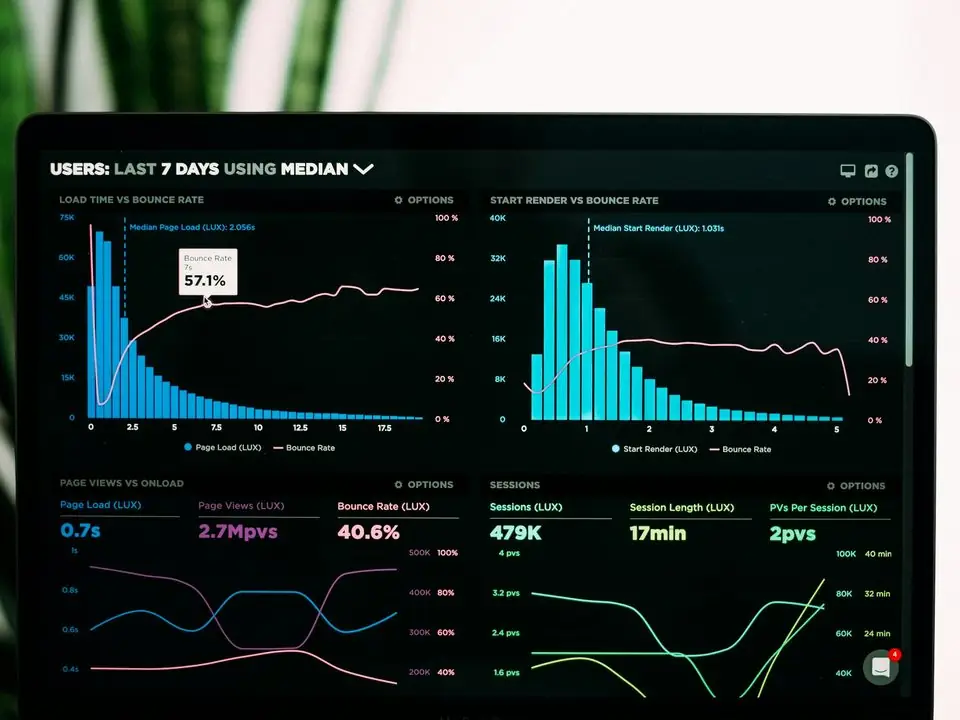
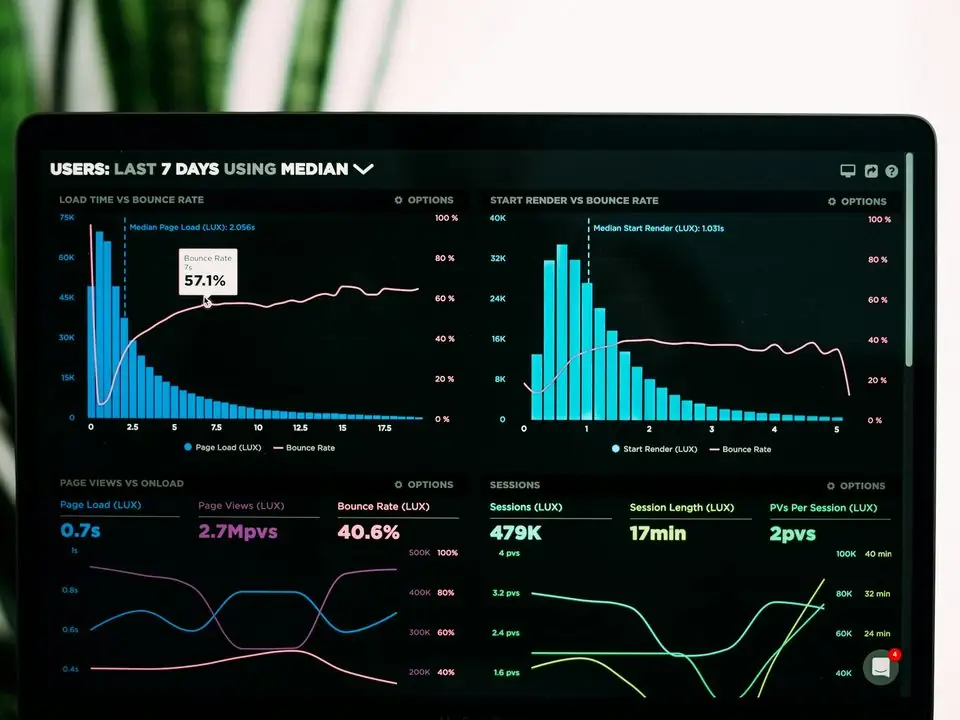
To answer those questions we build a layer above the ERP: data pipelines that extract from each source, a data warehouse or analytics store that holds clean, history-preserving tables, and a semantic model with shared definitions. Reports and visuals are then built in Microsoft Power BI or Zoho Analytics, depending on your platform, licences and team.
This is a step up from in-ERP dashboards. It suits groups with several entities, companies running more than one core system, and teams who need long histories, forecasts or what-if analysis without slowing down the live ERP.
BI projects fail when they start with charts. We start with a short list of decisions leadership wants to make better, such as which product lines to expand, which customers to reprice or which branch to restructure, and build only the data model those decisions need. Extra subject areas are added once the first release is trusted.
These signs usually mean it is time for a BI layer.
Sales live in the CRM, orders in the e-commerce platform, costs in the ERP and headcount in the HR system. Combining them takes days of spreadsheet work.
Entities in different emirates or free zones run separate databases or even different ERPs. Group results are stitched together manually each month.
Large historical reports run against the live database and slow down order entry for everyone else.
When a customer moves to a new salesperson or an item changes category, old reports change too. Trend analysis becomes unreliable.
Analysts build their own extracts and models, each with slightly different logic. Leadership sees conflicting numbers.
We build the foundation first, then the visuals.
We collect the business questions leadership wants answered and rank them by value. These define the first data model.
For each system we document available tables or APIs, keys, refresh options and data quality issues, including the ERP's chart of accounts and item master.
We build extraction and loading jobs into a warehouse such as Azure SQL, PostgreSQL or Zoho Analytics' own data store, with incremental refresh where possible.
We model facts and dimensions (sales, purchases, stock, GL, customers, items, dates, entities) with agreed measures, so every report uses the same logic.
Reports are built for priority use cases, with row-level security, workspace or folder structure and a process for requesting new content.
We hand over a documented platform your analysts can extend.
A first BI release usually covers a few high-value use cases. Further subject areas follow in phases.
Durations are typical ranges; your plan is agreed after discovery.
Agree questions, sources and access.
Build extraction, loading and data quality checks.
Model facts, dimensions and measures with finance.
Deliver priority reports and test with users.
Add HR, projects, service or forecasting in later releases.
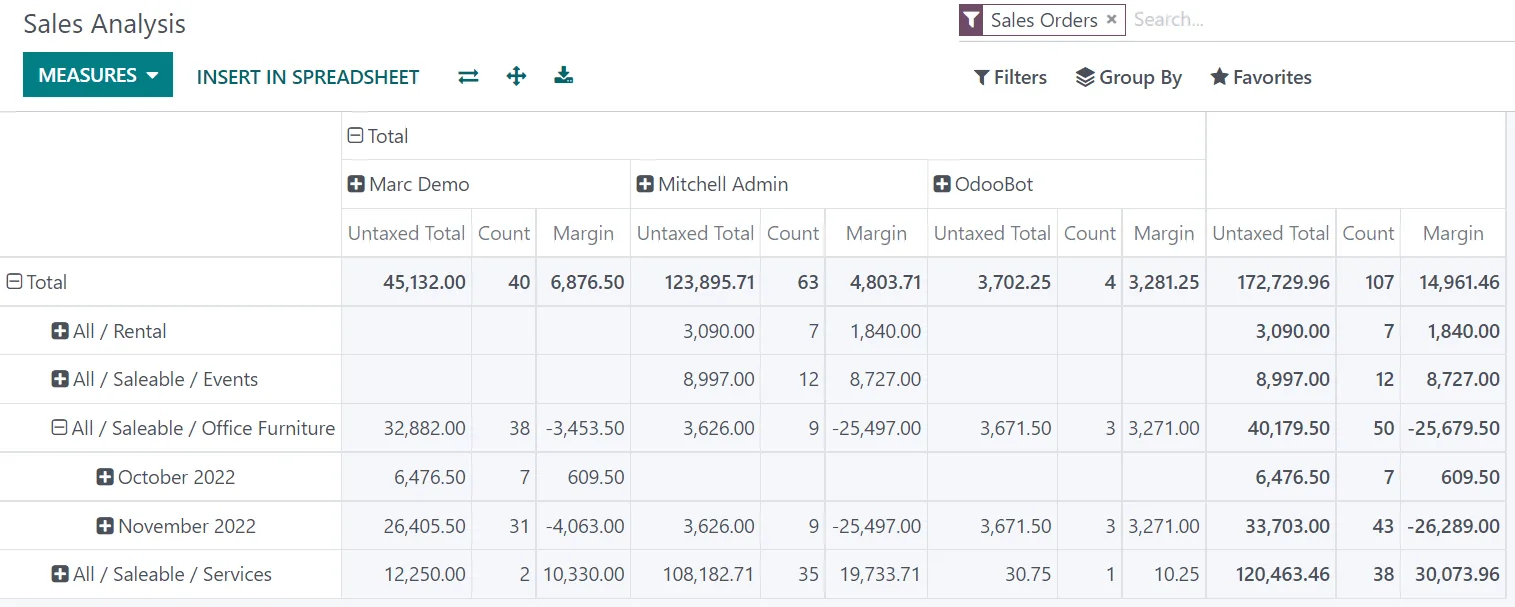
A BI model lets leadership compare entities and channels on the same basis.
These are typical goals of a BI program. Results depend on data quality and adoption.
Leadership can see how sales, marketing, operations and finance data relate, not just each system in isolation.
Heavy historical analysis runs on the warehouse, not the live transaction database.
History-preserving dimensions keep past results stable when master data changes.
Analysts build on a shared model, so new reports use the same definitions.
Explore tools and services connected to ERP analytics.
We configure the system for the rules UAE businesses report against, and test it before go-live.
General information, not tax or legal advice. Confirm current requirements with the FTA, MOHRE or your advisor. See all UAE compliance guides.
On-site workshops in Dubai, Abu Dhabi and Sharjah, and remote or on-site delivery across the Northern Emirates and free zones.
Official sources and references
Facts on this page were checked against these sources in October 2026. Rules change, so confirm current requirements before acting.
Still have a question? Our consultants are happy to help.
Ask an ExpertPower BI fits companies already on Microsoft 365 and Dynamics 365, with strong modeling and Excel links. Zoho Analytics fits Zoho One and Zoho Books users, with ready connectors to Zoho apps. Both can connect to Odoo or ERPNext through databases or APIs.
For one ERP and modest volumes, a BI tool's own data store may be enough. With several systems, long histories or group consolidation, a warehouse gives better control and performance.
Usually on a schedule, such as every few hours or nightly, depending on the tool, licence and source system. Truly live views are better served by native ERP dashboards.
Yes. Budgets, targets and manual adjustments often live in spreadsheets. We load them in a controlled way, ideally from a shared location with a fixed layout.
You do. We document the model and train your analysts, and we can provide ongoing support for new subject areas if you prefer.
Yes. Entities in Saudi Arabia, Oman or other GCC countries can be loaded into the same model, with currency conversion to AED or USD using agreed rates, so group results are compared on one basis.
Related Solutions
Related Industries
Related ERP Platforms
Share the questions your leadership cannot answer today and we will outline a first BI release.
Dubai, United Arab Emirates