L
O
A
D
I
N
G


Zoho, Odoo, ERPNext, Dynamics 365 and custom ERP, delivered by one accountable team.

We design dashboards around the decisions each role makes, from the CEO's weekly view to the warehouse supervisor's live picking queue.
ERP dashboard solutions in the UAE work best when each view is built around one role's decisions: revenue, margin and cash for the CEO, receivables, payables and bank position for the CFO, pipeline and targets for sales, and open orders and stock risks for operations. Native dashboards in Zoho, Odoo, ERPNext and Business Central read live data and respect access rights.
ERP Dashboard Solutions UAE projects start with one question per role: what does this person need to see to decide what to do next? A CEO wants revenue, margin and cash at a glance. A CFO wants receivables, payables and the bank position. A sales manager wants pipeline, orders and targets. An operations head wants open orders, stock risks and late deliveries.
We build those role-based views inside your ERP wherever possible, using the native dashboard tools in Zoho, Odoo, ERPNext and Dynamics 365 Business Central, so figures update as transactions are posted and access rights carry over automatically. Where a role needs data from several systems, we add a BI layer, described on our business intelligence page.
This differs from printed or emailed reports, which we cover under ERP reporting solutions. Dashboards are for watching and reacting; reports are for record and review. Many clients need both, and we design them so the numbers match.
A good dashboard project is mostly agreement work. Before building anything we sit with finance and the business to settle definitions: whether revenue is counted at invoice or delivery, whether margin includes landed costs, how a late order is defined. Once those are written down, the build itself is the shorter part of the job.

Plenty of companies have dashboards. Few have dashboards that managers open every day.
A single crowded screen tries to serve the owner, the accountant and the store manager. Nobody finds what they need quickly.
Gross margin means one thing to sales and another to finance. When the figures disagree, people stop trusting the dashboard.
Dashboards fed by weekly exports show last week's position. Managers go back to calling the team for the latest figure.
A chart shows overdue receivables but cannot open the list of customers behind it. The user has to search for them separately.
Owners of several UAE entities, or entities across the GCC, cannot see a consolidated position in one place without manual work.
We keep each dashboard small and tied to a role's real decisions.
Short sessions with the CEO, CFO, sales head and operations head to list the questions they ask every day and every week.
Each KPI gets a written definition, source, filter and owner, agreed by finance and the business. This prevents disputes later.
We confirm the ERP holds the needed fields, such as salesperson, branch, cost center or target, and fix gaps before building.
Dashboards are built natively with drill-down to orders, invoices or stock moves, and limited to five to eight tiles per role.
We check which tiles people use, remove what they ignore and add what they asked for.
Each dashboard is documented so it can be maintained in-house.
A first set of role dashboards is often ready in a few weeks, assuming the underlying data is in reasonable shape.
Durations are typical ranges; your plan is agreed after discovery.
Gather questions and current spreadsheets from each role.
Define and agree every KPI with finance and business owners.
Add missing fields, tags or targets needed for the KPIs.
Build role dashboards with drill-down and access rules.
Refine tiles based on real use.
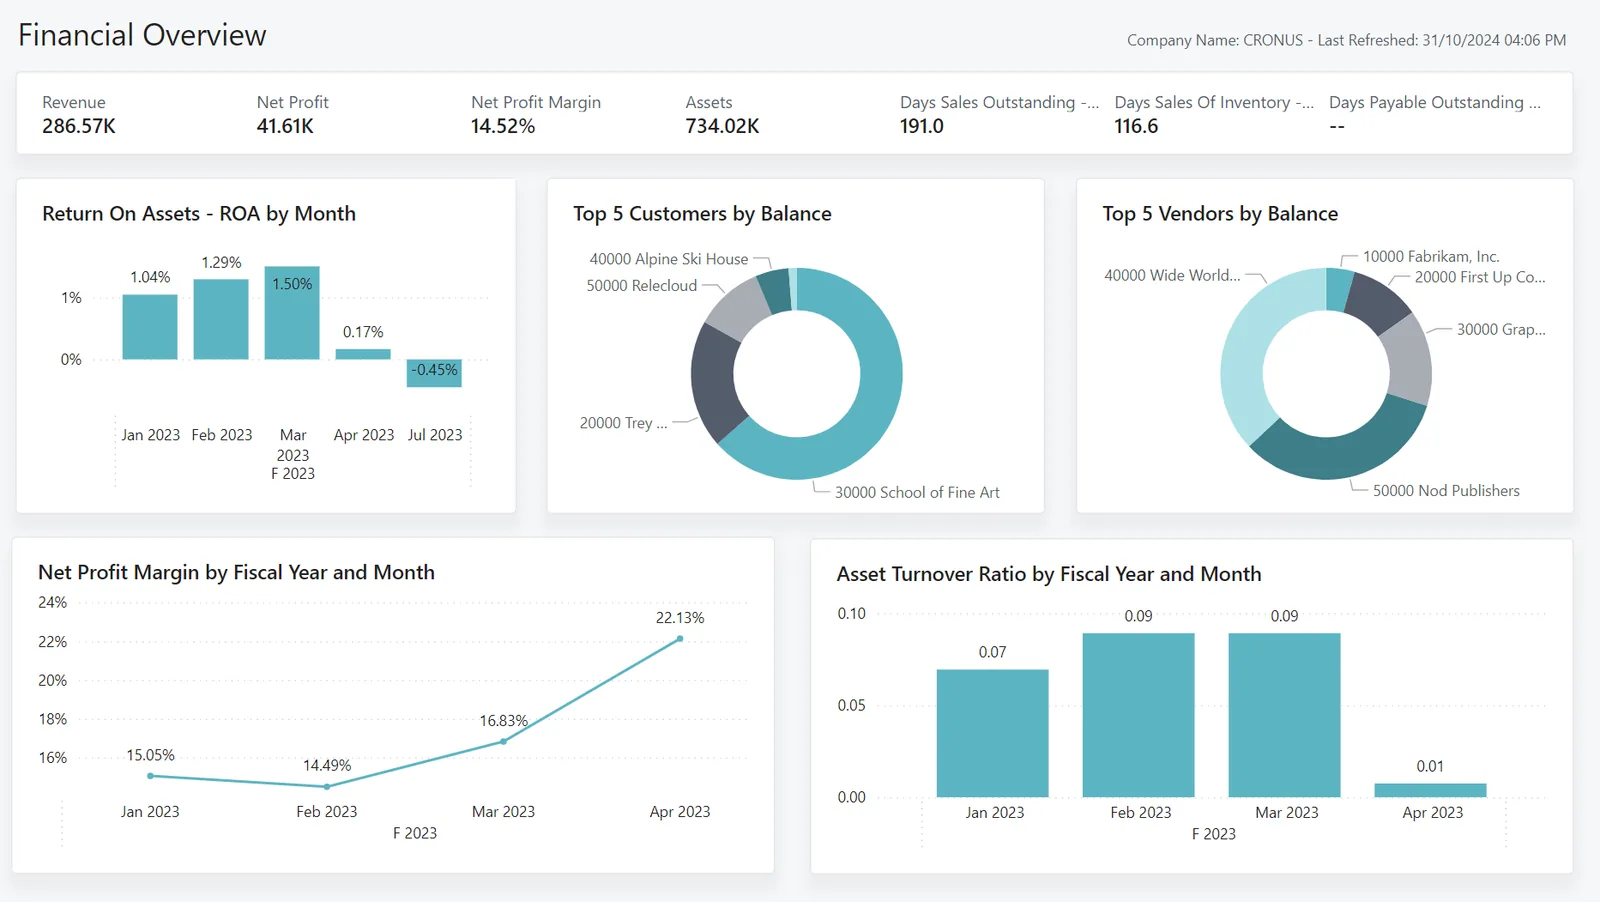
A leadership view focuses on a small set of numbers that change decisions.
These are the outcomes we design for, without promising numbers.
Managers see the current position without waiting for a report or calling the team.
The KPI dictionary means sales and finance quote the same margin and the same revenue.
Alerts for overdue customers, low stock or late orders surface problems before they grow.
Many ad hoc questions to finance are answered by the dashboard directly.
More on dashboards, reporting and BI.
We configure the system for the rules UAE businesses report against, and test it before go-live.
General information, not tax or legal advice. Confirm current requirements with the FTA, MOHRE or your advisor. See all UAE compliance guides.
On-site workshops in Dubai, Abu Dhabi and Sharjah, and remote or on-site delivery across the Northern Emirates and free zones.
Official sources and references
Facts on this page were checked against these sources in October 2026. Rules change, so confirm current requirements before acting.
Native ERP dashboards read live data, so they update as transactions are posted. BI dashboards usually refresh on a schedule, such as hourly or daily, depending on the tool and licence.
Yes. We apply role-based access and entity or branch filters so each user sees only the data they are allowed to see.
Not always. If all the data is in the ERP, native dashboards often cover the need. A BI tool helps when you combine several systems or need advanced visuals.
Most platforms show dashboards in their mobile apps or a mobile browser. We keep layouts simple so key tiles read well on a phone.
We usually aim for five to eight tiles per role. More than that and the important numbers get lost.
Yes, if targets and budgets are stored in the ERP or loaded from a controlled spreadsheet. Sales targets by person and branch, and budgets by cost center, let dashboards show actual against plan rather than raw totals.
Related Industries
Related ERP Platforms
Tell us which roles need better visibility and we will propose a first set of KPIs.
Dubai, United Arab Emirates