
L
O
A
D
I
N
G


Zoho, Odoo, ERPNext, Dynamics 365 and custom ERP, delivered by one accountable team.

Stop waiting for five department reports before the Sunday management meeting. A CEO dashboard pulls sales, margin, cash, operations and people data from the ERP into one view you can trust.
A CEO dashboard for a UAE company should show revenue, gross margin, cash position, order backlog, sales pipeline and headcount cost against budget on one screen, by group, entity and branch. It adds a short exception list of overdue receivables, stalled deals and delayed projects, with every tile drilling down to the underlying ERP document.
A CEO dashboard UAE business owners and managing directors actually use answers one question quickly: is the company on track this month, and if not, where is it slipping? It is not a finance report and not a sales report. It is a single executive screen that puts revenue, gross margin, cash position, order backlog, sales pipeline, headcount cost and a short list of exceptions side by side, broken down by legal entity, branch or business line.
In many UAE groups the reality is different. A trading company with a mainland LLC in Deira, a free zone entity in JAFZA and a branch in Abu Dhabi sends the CEO three Excel packs, each closed on a different date with different definitions of "sales". The sales director reports bookings, finance reports invoiced revenue net of VAT, and operations reports deliveries. By the time the numbers are reconciled, the month is over and the decision window has passed.
A dashboard built on the ERP fixes the definitions once. Revenue means posted tax invoices less credit notes, excluding VAT. Backlog means confirmed sales orders not yet delivered. Cash means reconciled bank balances plus undeposited PDCs, shown separately. The CEO then drills from a group figure into the entity, the branch and finally the document. For the wider role view, see our page on ERP for CEOs; for how the dashboards are built and hosted, see ERP dashboard solutions.

An illustrative executive screen for a group with three entities (mainland LLC, free zone company and an Abu Dhabi branch) and around 140 staff. Figures are month to date unless noted.
Revenue by entity (MTD)
Gross margin by business line
Pipeline by stage
Exceptions needing a decision
| Item | Owner | Impact | Status |
|---|---|---|---|
| Key account 60 days overdue | Sales director | AED 640K exposure | Payment plan proposed |
| Margin below floor on 3 tenders | Projects head | -4.1 pts | Pricing review Thursday |
| Supplier price increase (copper) | Procurement | AED 210K/quarter | Renegotiating |
| Abu Dhabi branch below budget | Branch manager | -18% vs plan | Action plan due |
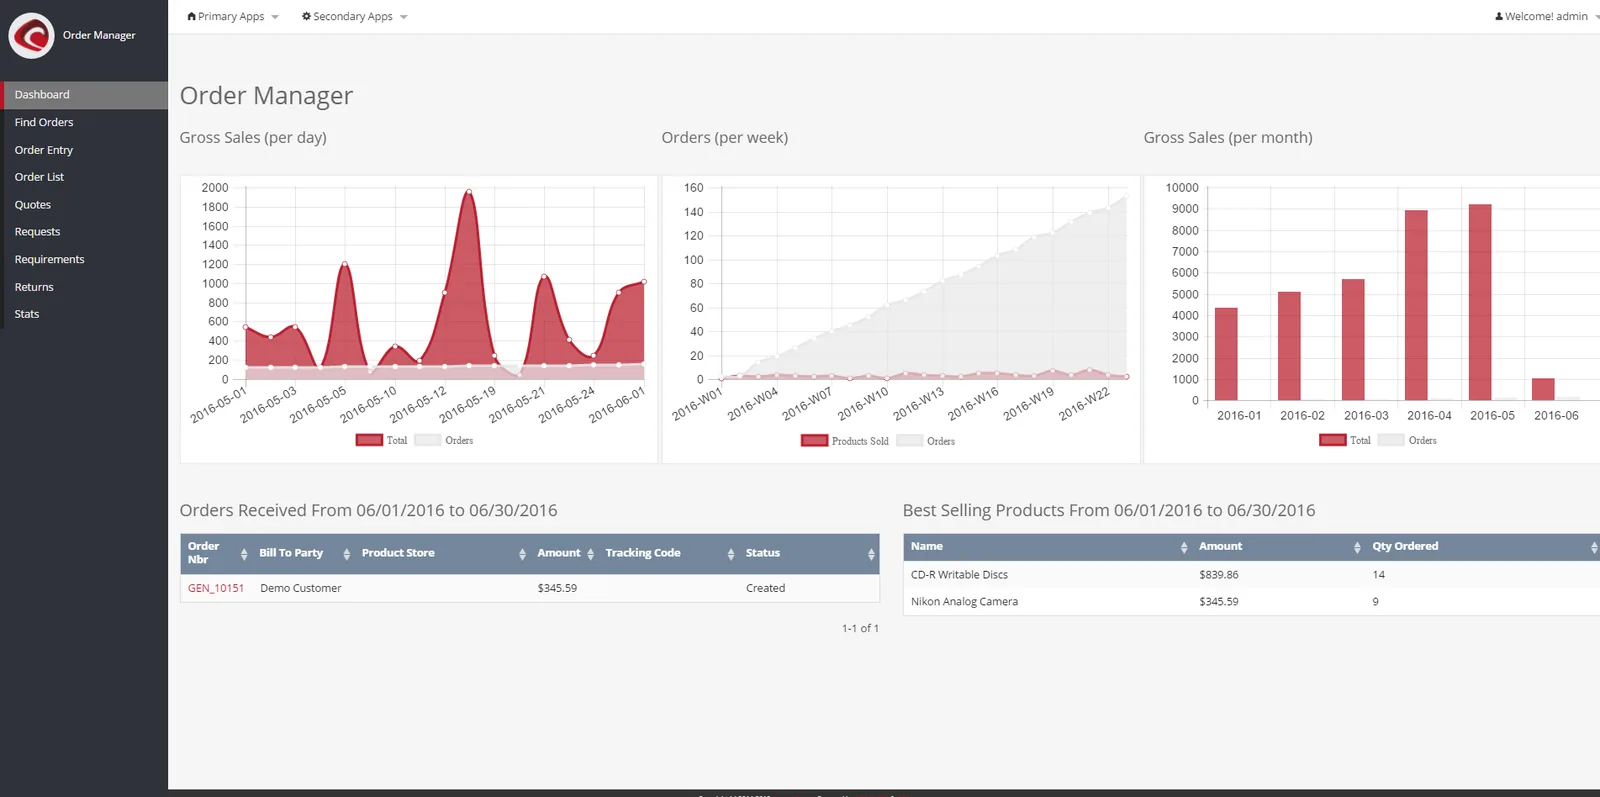
Most platforms deliver this view as a role-based home screen or an analytics workspace. The CEO sees summary tiles first; each tile opens a filtered report, and each report line opens the source document.
Agreeing definitions is most of the work. These are the KPIs we typically place on a CEO screen, with the ERP source and how often the executive team reviews them.
| KPI | What it shows | Source data | Review frequency |
|---|---|---|---|
| Revenue vs budget | Invoiced revenue net of VAT and credit notes against the approved budget | Posted sales invoices, credit notes, budget lines | Weekly |
| Gross margin % | Revenue less cost of goods or direct cost, by line of business | Invoices, COGS postings, project costs | Weekly |
| EBITDA | Operating profit before interest, tax, depreciation and amortization | General ledger mapped to a management P&L | Monthly |
| Cash position | Reconciled bank balances by bank and entity, with PDCs held shown separately | Bank accounts, bank reconciliation, PDC register | Daily |
| Overdue receivables | Customer balances past terms, grouped 30/60/90+ days | Customer ledger, payment terms | Weekly |
| Order backlog | Confirmed sales orders or contracts not yet delivered or billed | Sales orders, delivery notes, project contracts | Weekly |
| Weighted pipeline | Open opportunity value multiplied by stage probability | CRM opportunities | Weekly |
| On-time delivery % | Orders delivered on or before the promised date | Sales orders, delivery notes | Weekly |
| Headcount and payroll ratio | Active employees and monthly payroll cost as a share of revenue | HR master, payroll runs | Monthly |
| Budget variance by department | Spend against budget per cost center | GL with cost centers, budget | Monthly |
A CEO dashboard is only as reliable as the daily discipline behind it. This is the data flow we set up so that the numbers are current without anyone rebuilding a spreadsheet.
One shared database: every step updates stock, finance and reports in real time.
We keep the first version small and add only what the executive team asks for in review meetings.
Sit with the CEO, CFO and sales head and write down exactly how each figure is calculated, including VAT treatment, intercompany eliminations and the cut-off time.
If branches post invoices late or salespeople skip CRM stages, the dashboard will expose it. We set posting rules and mandatory fields before the first tile is built.
The layout follows the agenda of the weekly management meeting: performance, cash, pipeline, operations, people, decisions needed.
Each tile opens the matching departmental dashboard, for example the sales dashboard for pipeline or the project dashboard for overruns, so the CEO never needs a separate login.
Tiles nobody looks at are removed; questions asked repeatedly in meetings become new tiles.
The CEO screen usually sits on the ERP, with the analytics tool chosen to match the platform. For heavier group reporting, Power BI on top of the ERP is common.
We configure the system for the rules UAE businesses report against, and test it before go-live.
General information, not tax or legal advice. Confirm current requirements with the FTA, MOHRE or your advisor. See all UAE compliance guides.
On-site workshops in Dubai, Abu Dhabi and Sharjah, and remote or on-site delivery across the Northern Emirates and free zones.
Official sources and references
Facts on this page were checked against these sources in October 2026. Rules change, so confirm current requirements before acting.
Still have a question? Our consultants are happy to help.
Ask an ExpertThe CEO view covers the whole business: sales, operations, people and finance at summary level, with a short list of decisions. The CFO dashboard goes deeper into liquidity, working capital, tax position and forecasting. Many groups run both from the same ERP data.
Yes, if the entities share a chart of accounts or a mapping to one. The dashboard can show each entity and a combined view, with intercompany sales and balances eliminated so revenue is not counted twice.
Not always. Zoho Analytics, Odoo dashboards, ERPNext dashboards and Dynamics 365 role centers can cover a solid executive view. Power BI is useful when you combine several systems or want advanced modeling and mobile distribution across a group.
Transactional figures such as invoices and orders can be near real time inside the ERP. Analytics tools usually refresh on a schedule, often hourly or nightly. Bank-dependent figures are only as current as your last reconciliation.
Most platforms have mobile apps or responsive dashboards, and Power BI and Zoho Analytics both offer mobile apps. We usually design a simplified mobile layout with five or six tiles.
When the ERP data is clean, a first CEO dashboard is often ready in two to four weeks. If definitions are disputed or branches post late, expect extra time to fix the process first.
Related Solutions
Related Industries
Related ERP Platforms
Share your management pack and we will show you how a CEO dashboard could look on your ERP data.
Dubai, United Arab Emirates