
L
O
A
D
I
N
G


Zoho, Odoo, ERPNext, Dynamics 365 and custom ERP, delivered by one accountable team.

Connect Power BI to your ERP the right way: a governed data model, automatic refresh, security by role and reports that match the numbers in your ledger.
A UAE company should use Power BI on its ERP when it must analyze several systems together, model data beyond the ERP's own reports, or share governed reports across a group. A proper setup uses one semantic model, scheduled refresh from Odoo, ERPNext, Dynamics 365 or Zoho data, row-level security by company or branch, and totals that reconcile to the ledger.
A Power BI ERP dashboard in the UAE makes sense when you need to analyze more than one system together, model data in ways the ERP's own reports cannot, or share governed reports across a group. Typical cases are a holding company with a Dynamics 365 entity in Abu Dhabi and an Odoo entity in a free zone, a distributor combining ERP sales with Shopify and marketplace data, or a contractor joining ERPNext project costs with Primavera schedules.
If you run one ERP and need standard operational views, the built-in dashboards are often enough and cheaper to maintain. Power BI adds value when the questions cross systems: margin by customer including logistics cost from a 3PL file, or group cash across five companies and three banks. It also gives finance teams DAX measures, time intelligence and a semantic model that many users can reuse.
The hard part is never the charts. It is extracting ERP data reliably, building a star-schema model (facts for invoices, stock moves and journal lines; dimensions for customer, item, date, company and cost center) and making the totals reconcile to the trial balance. Our ERP Power BI integration work covers that pipeline; this page covers the dashboards built on it.

An example executive page for a UAE group with three companies on two ERPs, refreshed overnight. Figures are illustrative.
Revenue by entity
Gross margin by product group
Cash by bank
Top customers by margin
| Customer | Revenue | Margin % | Days to pay |
|---|---|---|---|
| Contractor A | AED 3.1M | 18% | 84 |
| Facility firm B | AED 2.4M | 27% | 52 |
| Retail chain C | AED 1.9M | 21% | 45 |
| Hotel group D | AED 1.2M | 33% | 61 |
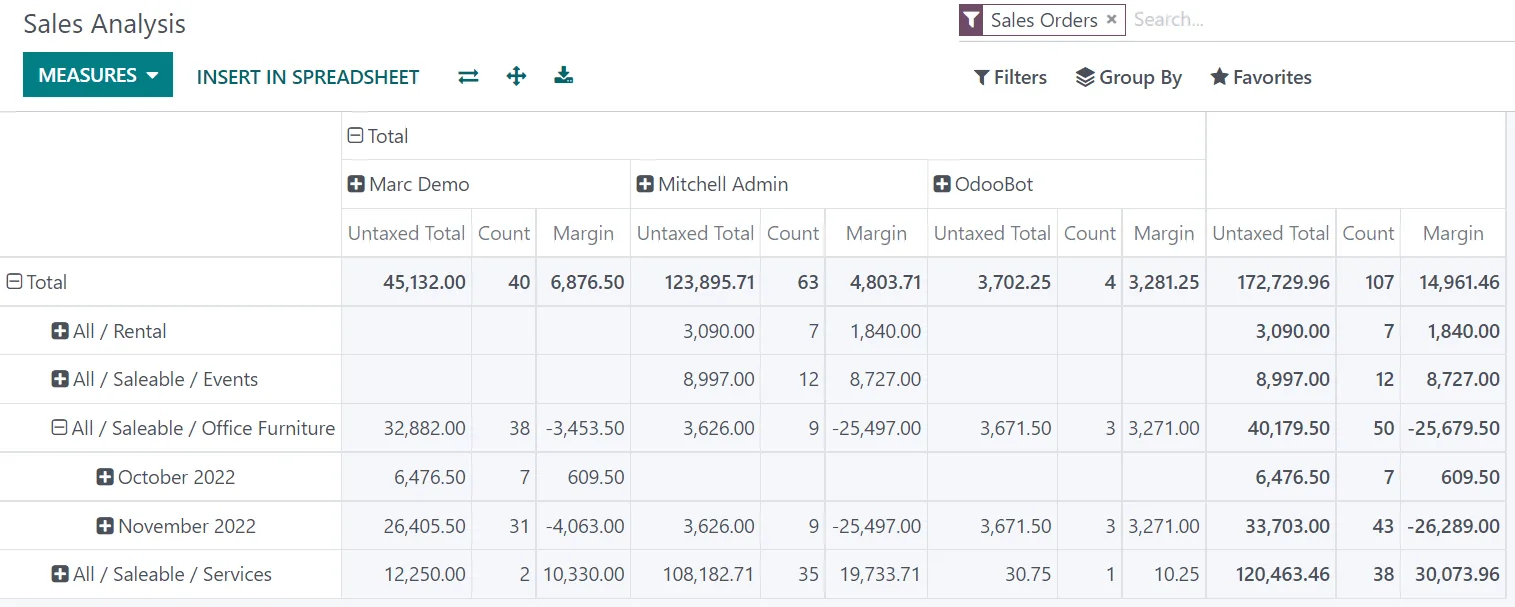
A typical rollout has an executive overview page plus drill-through pages for sales, receivables, inventory and cash. Users click a bar to filter every visual and drill to the invoice or item level.
These measures live in the semantic model once, then every report uses the same logic. Definitions are agreed with your finance team and tested against ERP reports.
| KPI | What it shows | Source data | Review frequency |
|---|---|---|---|
| Revenue (net of VAT, intercompany) | Recognized sales after credit notes and eliminations | Invoice lines, credit notes, company table | Daily |
| Gross margin | Revenue less cost of sales including landed cost | Invoice lines, stock valuation layers or GL | Weekly |
| Budget variance | Actual against budget by account and cost center | GL journal lines, budget table | Monthly |
| DSO and aging buckets | Receivables by 0-30, 31-60, 61-90, 90+ days | Open customer invoices and payments | Weekly |
| Cash position | Balances by bank and entity | Bank journals or bank statement lines | Daily |
| Inventory value and aging | Stock value by warehouse and age band | Stock ledger or valuation layers | Weekly |
| Purchase price variance | Actual purchase price against standard or last price | PO lines, vendor bills | Monthly |
| Sales vs prior year | Same-period comparison using a date table | Invoice lines, calendar dimension | Weekly |
| Output and input VAT summary | VAT by emirate and tax code from posted documents, for review only | Tax lines on invoices and bills | Quarterly |
| Payroll cost by department | Gross pay and overtime by cost center | Payroll journal or payroll export | Monthly |
Power BI reports support review and analysis; VAT returns should still be prepared from the ERP's tax reports. Confirm treatment with your tax advisor.
The connection method depends on the ERP and where it is hosted. We pick the simplest reliable route and document it so your team can support it.
One shared database: every step updates stock, finance and reports in real time.
Each ERP connects differently. Dynamics 365 has Microsoft's own connectors to Dataverse and Business Central. For self-hosted Odoo or Odoo.sh, see Odoo Power BI integration; Odoo Online normally limits direct database access, so the external API or a connector app is used. For ERPNext, a read-only database user or the REST API works, as described on ERPNext Power BI integration. Zoho data can go to Power BI through exports or third-party connectors, though many Zoho users find Zoho Analytics simpler.
These decisions are cheap at the start and expensive to change after fifty users rely on the reports.
We configure the system for the rules UAE businesses report against, and test it before go-live.
General information, not tax or legal advice. Confirm current requirements with the FTA, MOHRE or your advisor. See all UAE compliance guides.
On-site workshops in Dubai, Abu Dhabi and Sharjah, and remote or on-site delivery across the Northern Emirates and free zones.
Official sources and references
Facts on this page were checked against these sources in October 2026. Rules change, so confirm current requirements before acting.
Still have a question? Our consultants are happy to help.
Ask an ExpertUse the built-in dashboards for day-to-day operational views inside one ERP. Choose Power BI when you combine several systems, need group consolidation or advanced modeling, or already use Microsoft 365 widely. Our ERP dashboard solutions team can help you decide per use case.
Under Microsoft's current licensing, scheduled imports allow a limited number of refreshes per day on Pro and more on Premium or Fabric capacity; check the latest limits for your licence. DirectQuery can show near-live data but puts load on the ERP database, so we use it carefully.
Odoo Online usually does not give direct database access, so the usual route is the Odoo external API through middleware or a connector app, landing data in a dataflow or small warehouse. Self-hosted Odoo and Odoo.sh offer more options.
They should, and we prove it. We build reconciliation checks against the trial balance, receivables aging and stock valuation, and investigate any difference before go-live. Most differences come from cancelled documents, intercompany entries or timing of refresh.
Yes. Row-level security filters every visual by the user's role, for example a branch manager in Al Ain sees only Al Ain, while the CFO sees the group. The same model serves both without duplicate reports.
Usually a group finance view, similar in scope to our finance dashboard, and a sales and margin view, then receivables and inventory. Operational pages such as the production dashboard come later once the core model is trusted.
Related Solutions
Related Industries
Related ERP Platforms
Tell us which ERPs and data sources you run and we will outline the connection method, data model and first report pages.
Dubai, United Arab Emirates