L
O
A
D
I
N
G


Zoho, Odoo, ERPNext, Dynamics 365 and custom ERP, delivered by one accountable team.

Give plant managers and owners one shift-by-shift view of output, downtime, scrap and material usage, built from the work orders and job cards your team already records.
A production dashboard for a UAE factory shows output versus plan by line, shift and product, OEE split into availability, performance and quality, scrap and rework, material variance against the BOM, and schedule adherence. It is built from the work orders, job cards and quality checks the team already records in the ERP, refreshed through the shift.
A production dashboard UAE manufacturers rely on shows what the factory made against what it planned, why the gap exists, and what it cost. In plants across Dubai Industrial City, Sharjah, Ajman and KEZAD, the usual picture is a whiteboard on the shop floor, a supervisor's shift report in Excel and a monthly costing exercise that arrives too late to change anything.
When manufacturing orders, job cards and material issues are recorded in the ERP, the same data can answer questions in near real time: which lines are behind schedule, which machine lost the most hours this week, which product has a scrap rate drifting upward, and whether actual resin, steel or flour consumption matches the bill of materials.
This page covers the production view: output, efficiency, quality and cost on the shop floor. Planning the schedule itself is covered under production planning software, and finished-goods stock belongs on the inventory dashboard.
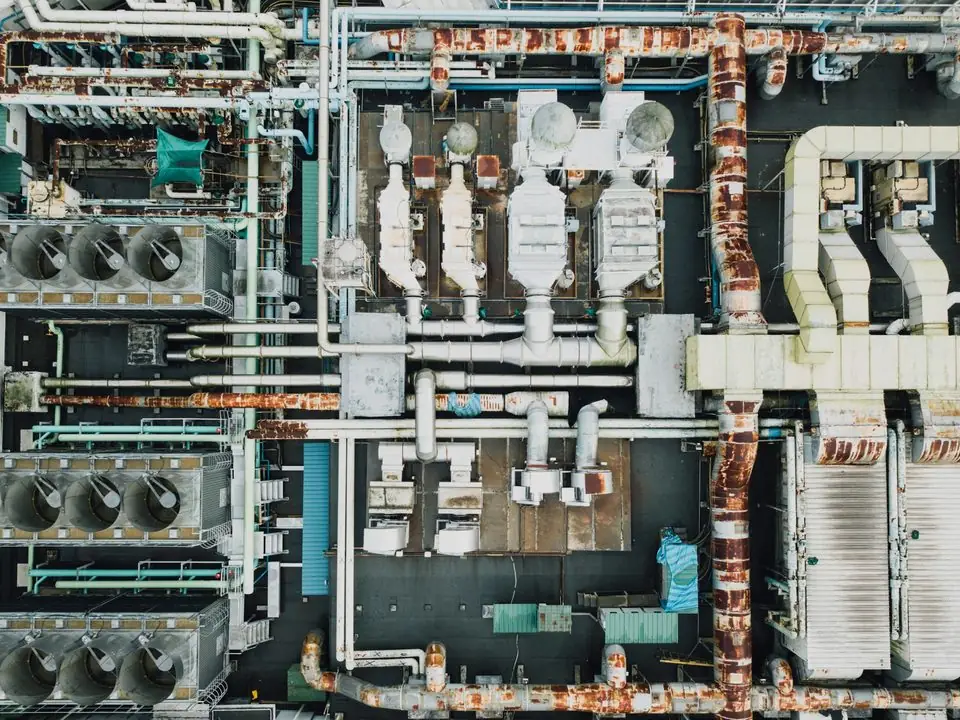
How a plastics and packaging manufacturer in Sharjah running three extrusion lines on two shifts might see last week.
Downtime by reason (hours)
Output vs plan by line
Scrap by product family
Orders behind schedule
| MO | Product | Planned qty | Completed |
|---|---|---|---|
| MO-3381 | Printed pouch 250g | 40,000 | 26,500 |
| MO-3394 | Garbage bag 55 gal | 18,000 | 12,200 |
| MO-3402 | Shrink film 50mic | 9 tons | 6.1 tons |
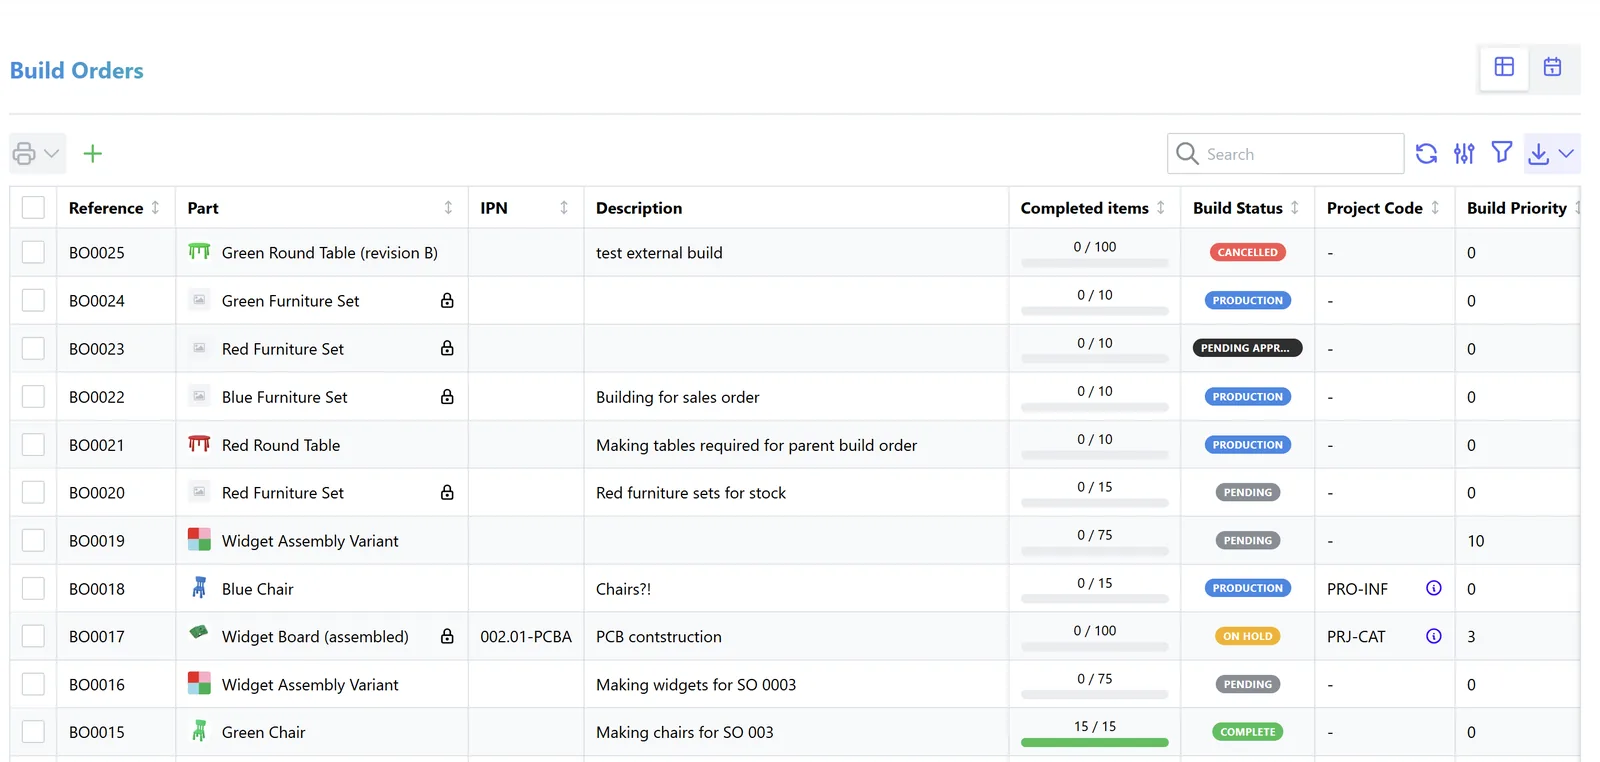
This is the view supervisors check at shift handover and the plant manager reviews in the morning meeting.
Use one written definition for each KPI. OEE in particular is calculated differently in almost every plant, so fix the formula before comparing lines.
| KPI | What it shows | Source data | Review frequency |
|---|---|---|---|
| Output vs plan | Good quantity produced against scheduled quantity | Manufacturing orders, production schedule | Per shift |
| OEE | Availability x performance x quality for a machine or line | Job card times, ideal cycle time, good and rejected quantity | Daily |
| Schedule adherence | Orders completed on their planned date | MO planned and actual finish dates | Weekly |
| Unplanned downtime | Hours lost to breakdowns, shortages and holds, by reason | Downtime entries on job cards or machine log | Daily |
| Scrap rate | Rejected or scrapped quantity as a share of total produced | Scrap entries per operation | Per shift |
| First-pass yield | Units passing quality checks without rework | Quality checks, rework orders | Weekly |
| Material usage variance | Actual materials issued versus BOM standard | Stock issues to MO, BOM | Per order, monthly summary |
| WIP value | Cost tied up in unfinished orders | Open MOs, issued materials, booked labor and overhead | Weekly and month end |
| Labor efficiency | Standard hours earned versus actual hours booked | Routings, job card time logs | Weekly |
| Cost per unit vs standard | Actual production cost against standard cost | Closed MOs, cost roll-up | Monthly |
The dashboard is only as current as the shop-floor entries. Tablets or terminals at each work center make the difference between a live view and a next-day report.
One shared database: every step updates stock, finance and reports in real time.
Plants that try to measure everything on day one usually end up measuring nothing reliably.
Record good and rejected quantity per order and shift. This alone shows which lines and products need attention.
Agree a short list of five to eight reasons and make supervisors pick one when a machine stops. Long reason lists get ignored.
Set ideal cycle times for one bottleneck line, validate the numbers with the plant manager, then extend to the others.
Once quantities and times are trusted, bring in material variance, WIP and production costing so the finance team sees the same story.
Machine counters or PLC data can feed output automatically on high-volume lines; manual entry is often fine elsewhere.
Most data comes from the manufacturing module. The rest depends on how automated your shop floor is.
We configure the system for the rules UAE businesses report against, and test it before go-live.
General information, not tax or legal advice. Confirm current requirements with the FTA, MOHRE or your advisor. See all UAE compliance guides.
On-site workshops in Dubai, Abu Dhabi and Sharjah, and remote or on-site delivery across the Northern Emirates and free zones.
Official sources and references
Facts on this page were checked against these sources in October 2026. Rules change, so confirm current requirements before acting.
Still have a question? Our consultants are happy to help.
Ask an ExpertNo. Many UAE plants start with operators logging start, stop, downtime reason and quantities on a tablet against the job card. Sensors improve accuracy on fast lines, but manual data that is entered every shift is far better than none.
Odoo Manufacturing, ERPNext Manufacturing and Dynamics 365 (Business Central or Supply Chain Management) all have work orders, routings and BOMs. Zoho's manufacturing capabilities are lighter; manufacturers on Zoho typically use assemblies in Zoho Inventory, a custom Zoho Creator app or a dedicated MRP add-on, so confirm current options for your edition. Our ERP dashboard software guide compares the reporting layers.
Breakdown downtime on the production dashboard should match work orders raised in maintenance. Linking the two shows which machines need preventive plans; see machine maintenance in ERP.
Yes. Comparing remaining quantity and work center capacity against the due date flags at-risk orders. Detailed rescheduling is a planning task covered by production scheduling software.
WIP is usually materials issued plus labor and overhead booked to open orders. The method should match your accounting policy, so agree it with finance and your auditor before the dashboard figure is used for reporting.
Supervisors need their line and shift, the plant manager needs all lines, and owners usually need a weekly summary with cost. Role-based views keep each group focused.
Related Solutions
Related Industries
Related ERP Platforms
Tell us about your lines, products and how you record production today, and we will show a dashboard built on your manufacturing orders.
Dubai, United Arab Emirates