L
O
A
D
I
N
G


Zoho, Odoo, ERPNext, Dynamics 365 and custom ERP, delivered by one accountable team.

Give the warehouse manager and shift supervisors a live view of what has arrived, what is waiting to be picked, what has shipped late and how each team is performing.
A warehouse dashboard for UAE operations should show flow by shift: expected receipts, GRNs pending putaway, dock-to-stock time, pick backlog, orders due before carrier cut-off, on-time dispatch, pick errors, cycle count variances and lines picked per hour by picker. Built on ERP warehouse transactions captured by barcode scanning, it replaces whiteboards and WhatsApp updates in Jebel Ali, DIP and Sharjah warehouses.
A warehouse dashboard UAE warehouse managers use is about flow, not value. At 7 am the supervisor needs to know how many containers are due at the dock, how many receipts from yesterday are still not put away, how many orders must leave before the 2 pm truck cut-off, which pickers are behind, and whether the transfer to the Abu Dhabi branch has actually left. Those are counts and times, measured by shift.
Many warehouses in Jebel Ali, Dubai Investment Park, Al Quoz and Sharjah run these decisions from whiteboards and WhatsApp groups. Pick lists are printed, ticked by hand and keyed back into the ERP hours later, so the system shows stock that has already left. Delivery promises are made by sales without seeing the pick backlog, and the manager discovers late shipments only when customers call.
A dashboard built on ERP warehouse transactions, ideally captured with barcode scanners, shows the live position of every inbound, internal and outbound task. It complements the inventory dashboard, which focuses on stock value and replenishment. For the system that generates these tasks, see warehouse management software.

Illustrative figures for a single-shift warehouse with 14 staff shipping to retailers and contractors across the UAE.
Open picks by zone
Orders shipped by hour
Lines picked per hour by picker
Late or at-risk orders
| Order | Customer area | Promised | Status |
|---|---|---|---|
| SO-4418 | Abu Dhabi | Today 2 pm | Picking 60% |
| SO-4422 | Dubai Marina | Today 2 pm | Short 2 lines |
| SO-4397 | Sharjah | Yesterday | Awaiting packing |
| TR-0215 | Al Ain branch | Today | Loaded, not dispatched |
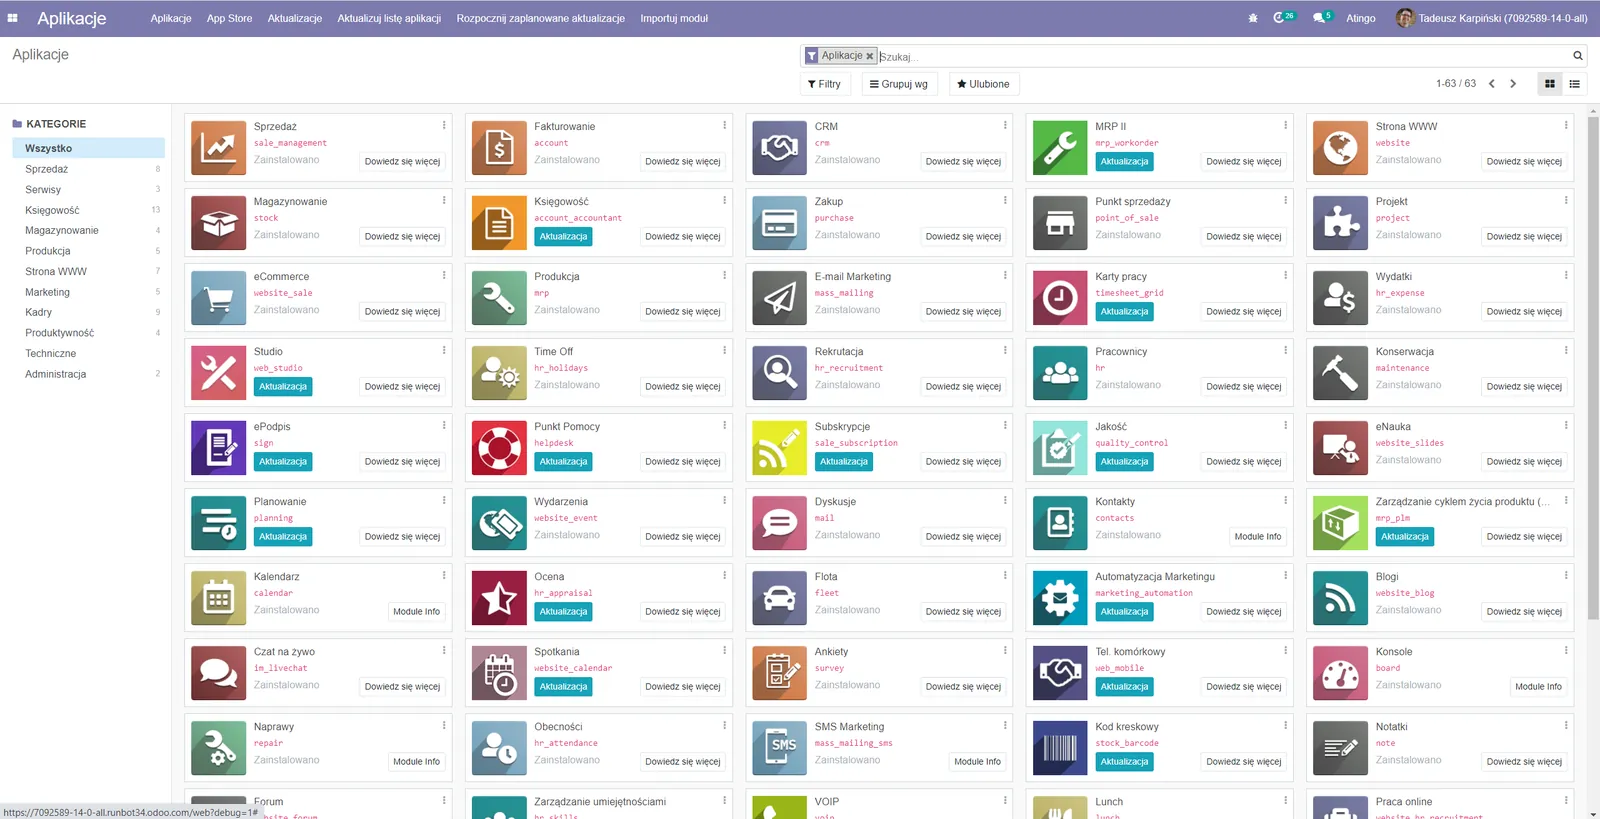
Warehouse apps typically show operations as transfer or task lists by type; the dashboard groups them by status, zone and due time.
Most of these KPIs depend on timestamps, so they are only reliable when tasks are confirmed by scanning at the moment they happen.
| KPI | What it shows | Source data | Review frequency |
|---|---|---|---|
| Inbound due | Expected receipts by date from open purchase orders and ASNs | Purchase orders, expected arrival dates | Daily |
| GRNs pending putaway | Received goods not yet moved to a storage bin | Receipt and putaway transfers | Each shift |
| Dock-to-stock time | Hours from GRN to putaway confirmation | Timestamps on receipt and putaway | Weekly |
| Pick backlog | Orders and lines released but not yet picked | Pick lists or picking transfers | Hourly |
| On-time dispatch | Orders shipped on or before the promised date | Delivery notes, sales order dates | Daily |
| Pick accuracy | Lines picked correctly as a share of all lines picked | Scan verification, customer claims | Weekly |
| Lines picked per hour | Picking productivity per person and shift | Pick confirmations, user, time | Daily |
| Transfers in transit | Stock dispatched from one warehouse and not yet received at the other | Transit location, transfer orders | Daily |
| Bin utilization | Occupied storage locations as a share of capacity | Bin master, stock by location | Weekly |
| Cycle count accuracy | Counted lines matching system quantity | Cycle count results | Weekly |
| Returns to process | Customer returns received but not inspected or restocked | Return receipts | Daily |
Each step creates a timestamped record that feeds the dashboard. Picking strategy is covered in ERP for warehouse picking.
One shared database: every step updates stock, finance and reports in real time.
We start from the warehouse's daily routine and work back to the data needed.
Define warehouses, zones and bins in the ERP so tasks and utilization can be measured by area. Odoo warehouse management and the other platforms we implement all support multi-step routes.
Mobile barcode scanning for receipts, putaway, picks and counts turns paper ticks into timestamps, which most warehouse KPIs need.
Delivery promises and truck cut-off times on sales orders let the dashboard flag at-risk orders before they become late.
Use transit locations for stock moving between sites so nothing disappears between warehouses. See ERP for warehouse transfers.
Use the dashboard in the weekly operations meeting and adjust targets by zone and shift.
Warehouse dashboards draw on the ERP plus devices and carriers. Sales and customer promises come from the sales side.
We configure the system for the rules UAE businesses report against, and test it before go-live.
General information, not tax or legal advice. Confirm current requirements with the FTA, MOHRE or your advisor. See all UAE compliance guides.
On-site workshops in Dubai, Abu Dhabi and Sharjah, and remote or on-site delivery across the Northern Emirates and free zones.
Official sources and references
Facts on this page were checked against these sources in October 2026. Rules change, so confirm current requirements before acting.
Still have a question? Our consultants are happy to help.
Ask an ExpertNot strictly, but time-based KPIs such as dock-to-stock time and lines per hour depend on tasks being confirmed when they happen. Without scanning, you can still track counts and backlogs, though with less precision.
Yes. It can show each site separately and a combined view, including transfers in transit between them. Supervisors usually see only their site.
Either by scan verification at pick or pack, which catches errors before dispatch, or by counting customer claims for wrong or short items. Scan verification is more reliable and gives faster feedback.
If the 3PL shares receipt and dispatch confirmations through a portal, file or API, those can update the ERP and appear on the dashboard. The level of detail depends on what the 3PL provides.
Lines per hour should be compared within the same zone and order type, because picking bulk pallets is different from picking small parts. We group productivity by zone to keep comparisons fair.
The warehouse dashboard tracks tasks and timing; the inventory dashboard tracks stock levels and value. Both use the same stock moves, so improving warehouse discipline also improves inventory accuracy.
Related Solutions
Related Industries
Related ERP Platforms
Walk us through a day in your warehouse and we will sketch the dashboard your supervisors need.
Dubai, United Arab Emirates