L
O
A
D
I
N
G


Zoho, Odoo, ERPNext, Dynamics 365 and custom ERP, delivered by one accountable team.

Directors want to know three things every Monday: are we on time, are we inside budget, and is cash coming in. A construction project dashboard answers all three from live ERP data.
A construction project dashboard for UAE contractors shows, from live ERP data, whether each project is on time, inside budget and collecting cash. Core tiles cover total project value with approved variations, progress, committed cost, actual cost, budget variance, procurement status, subcontractor payments, receivables, retention and profitability. Committed cost from POs and subcontracts reveals overruns before invoices arrive.
In many UAE contracting companies, project reporting is a monthly Excel pack. The QS updates the cost-to-complete, accounts exports the ledger, the commercial manager adds the IPC status, and by the time the directors see it the figures are three weeks old. A construction project dashboard pulls the same numbers straight from the ERP, so the managing director, the project director and the finance manager look at one version of each project, updated as transactions are posted.
A useful dashboard covers the full commercial picture of a project: total project value including approved variations, physical and financial progress, committed cost from POs and subcontracts, actual cost posted, budget variance, procurement status, material utilisation, subcontractor payments, receivables, retention and the resulting profitability. Each of those numbers already exists somewhere in a well-configured construction project management ERP. The dashboard simply puts them side by side.
This page is about the dashboard layer: which tiles and drill-downs to build, where each figure comes from, and how the four main platforms deliver it. If you need the costing logic underneath, see construction project costing software; for the deeper margin analysis behind the profit tile, see construction profitability software.
Most of these problems come from figures being assembled by hand from different systems.
The ledger shows what has been invoiced, but not the steel PO issued last week or the MEP subcontract signed yesterday. A project can look healthy on actuals while its commitments already exceed the budget.
The planning engineer reports 60% complete from Primavera while the QS has certified 45% of value. Without both on one screen, nobody asks why the gap exists.
Interim payment certificates sit with the consultant for weeks. Finance sees an unpaid invoice, but nobody sees that the certificate has not even been approved yet.
Retention held by clients and retention withheld from subcontractors are tracked in separate spreadsheets. Large amounts are not chased at practical completion or end of the defects liability period.
By the time a monthly pack shows a cost overrun, the materials have been bought and the labour has been paid. The report explains the loss instead of preventing it.
The dashboard is only as reliable as the documents behind it. This is the chain we set up so each tile is traceable.
One shared database: every step updates stock, finance and reports in real time.
An illustrative layout of the tiles, charts and exception table we typically build for the director's view.
Budget vs forecast cost by project
Receivables by age
Procurement status of open POs
Projects needing attention
| Project | Progress | Cost variance | Overdue IPC |
|---|---|---|---|
| Villa cluster, Dubai South | 62% | -AED 1.4M | IPC 9, 34 days |
| Warehouse, Mussafah | 48% | -AED 0.9M | None |
| School block, Sharjah | 71% | -AED 0.6M | IPC 12, 21 days |
| Retail fit-out, Al Barsha | 35% | +AED 0.2M | None |
Each tile depends on a module being used properly. If one is missing, the dashboard will show a gap instead of a number.
Contract value, BOQ items and approved variations, which together give the current total project value.
Original and revised budgets per cost code, the baseline for every variance figure on the dashboard.
Purchase requests, POs and delivery dates, which drive committed cost and the procurement status tiles.
Material issues against activities, compared with BOQ quantities to show material utilisation and wastage.
Subcontract values, payment certificates, deductions and retention withheld, so subcontractor payments are visible per project.
Labour hours per project and cost code, costed at the right rate, which is often the least visible cost on site.
IPCs, certified amounts, invoices and retention receivable, which drive receivables and the cash view.
Built-in dashboards or a BI tool that combines the above into portfolio and project views with drill-down.
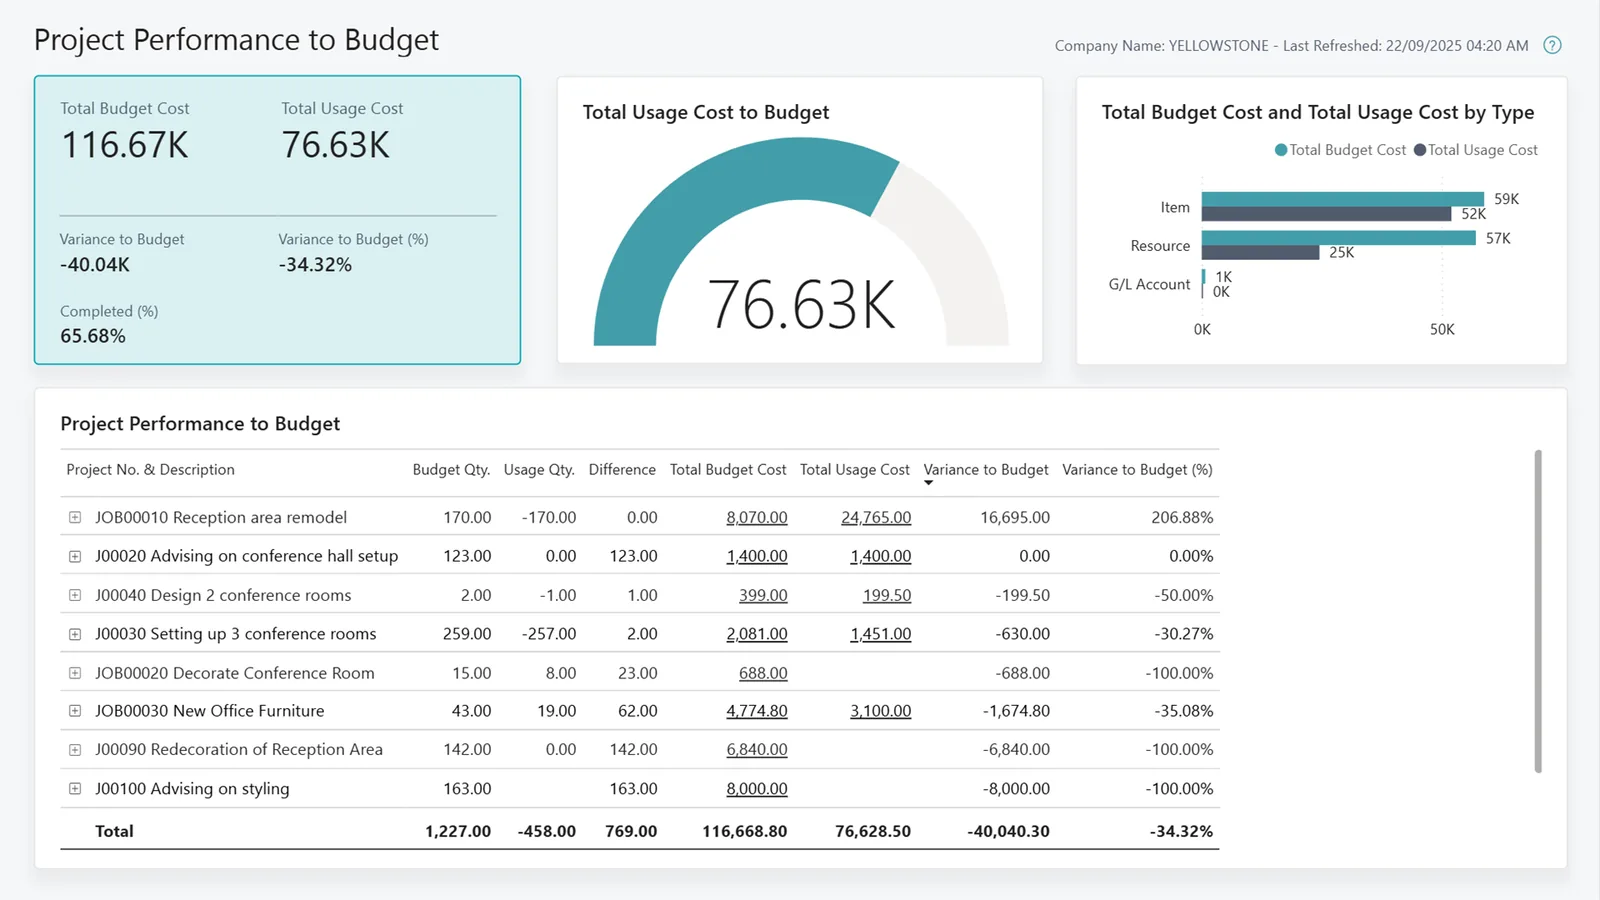
Directors look at the tiles; PMs and QS live in the drill-downs. These are the reports we build for each project.
All four can produce this dashboard. They differ in how much is out of the box and whether a separate BI tool is needed. Confirm for your edition.
| Zoho | Odoo | ERPNext | Dynamics 365 | |
|---|---|---|---|---|
| Native project dashboards | Zoho Projects dashboards for tasks, milestones and timesheets; financial views via Zoho Analytics | Project and accounting dashboards, with analytic accounts per project | Project, budget and cost center reports with configurable workspaces | Business Central role centers and job reports; project dashboards in Finance and Operations |
| Committed vs actual cost | Usually built in Zoho Analytics from Books purchase orders and bills | Analytic budgets can show committed and actual in recent versions; confirm for your version | Budget variance and purchase order reports by project; committed view often needs a custom report | Job ledger and open purchase lines; Finance and Operations project cost control |
| Progress and IPC tracking | Milestones in Zoho Projects; IPC register usually a custom module | Milestone billing; IPC logic often customized | Project progress and billing by milestone; IPC usually customized | Job WIP and progress billing; construction add-ons extend it |
| Retention view | Custom fields and reports | Custom configuration or community apps | Custom fields or app; common in construction implementations | Partner add-ons or configuration |
| BI and drill-down | Zoho Analytics with native connectors | Odoo spreadsheets and dashboards; Power BI via connector | Report builder, dashboards and query reports; Power BI or Metabase externally | Power BI with native integration |
We implement all four and recommend by fit with your existing systems and reporting needs.
Most contractors have at least one system outside the ERP that the dashboard needs to read.
The dashboard is a management tool, but several of its numbers also feed tax and statutory reporting. Confirm treatments with your tax advisor.
Each interim invoice carries 5% VAT and its own tax point. A receivables tile that separates VAT from the net amount helps finance reconcile collections with the VAT return. See VAT ERP for the UAE.
Project margins roll up into taxable income at 9% above AED 375,000. Consistent cost allocation and revenue recognition make the year-end figure easier to support.
Client invoices and supplier bills move to the PINT AE format through Accredited Service Providers in phases from 2027 (check the latest Ministry of Finance / FTA guidance). Dashboards should read from the ERP invoice, not a separate billing sheet.
Salaries paid through the Wage Protection System are a large part of project cost. Allocating payroll to projects from timesheets keeps the labour tile accurate.
General information, not tax or legal advice. Rules change; confirm current FTA, MOHRE and Ministry of Finance guidance with your advisor.
No percentages here; these are the practical changes management teams report.
Cost problems appear when the PO is raised, not when the invoice arrives months later.
Monthly project reviews start from the same live figures instead of reconciling three spreadsheets.
Overdue IPCs and retention due for release are listed per project, so someone owns each one.
Directors spot slipping margin while there is still scope to claim variations or re-plan the work.
Typical ranges; much depends on whether budgets, POs and IPCs are already in the ERP.
Durations are typical ranges; your plan is agreed after discovery.
Agree tiles, definitions and drill-downs with directors, project managers and finance.
Make sure budgets, cost codes, POs, subcontracts and IPCs are recorded per project in the ERP.
Build the dashboard, then test every tile against a manual reconciliation for two or three projects.
Train users, set review routines, and adjust tiles after the first monthly cycles.
We configure the system for the rules UAE businesses report against, and test it before go-live.
General information, not tax or legal advice. Confirm current requirements with the FTA, MOHRE or your advisor. See all UAE compliance guides.
On-site workshops in Dubai, Abu Dhabi and Sharjah, and remote or on-site delivery across the Northern Emirates and free zones.
Official sources and references
Facts on this page were checked against these sources in October 2026. Rules change, so confirm current requirements before acting.
Still have a question? Our consultants are happy to help.
Ask an ExpertAt minimum: total project value, progress, committed cost, actual cost, budget variance, procurement status, material utilisation, subcontractor payments, receivables, retention and profitability. Start with those and add more only when someone will act on them.
You can, but someone has to refresh and reconcile the data every time. The value of an ERP-backed dashboard is that every number comes from a posted document and can be drilled into.
Committed cost is what you have agreed to spend through POs and subcontracts but not yet been billed for. Actual cost is what has been posted. Watching both is the only way to see an overrun before the invoices arrive.
No. Directors need a portfolio view with exceptions; project managers need cost codes, POs and site detail. Our page on ERP for construction project managers covers their view.
Yes, usually through a scheduled import or an integration that brings activity progress into the ERP project. That lets the dashboard compare planned, physical and certified progress side by side.
A general project dashboard focuses on tasks, hours and milestones. A construction dashboard adds BOQ, IPCs, retention, subcontractor certificates and committed cost, which most service projects never need.
Related Solutions
Related Industries
Related ERP Platforms
We will show a working construction dashboard on your chosen platform and map which of your data sources it needs.
Dubai, United Arab Emirates